Nothing to Do with Changes in Sea Level
Part VI of our series on sea level rise and flooding of Portsmouth explains what drives tides and storm surges. It complements the case study in Part V. The key take-away here is that the drivers of tides and storm surges are celestial and meteorological.
Climate change does not drive the motion of the heavenly bodies. Tides are independent of climate change.
Given all we have discussed in Parts I through V, the prospect of a 1.7-foot sea level rise due to climate change by 2050 seems unlikely and overstated. The Climate Chicken Littles who say Portsmouth will experience devastating sea level rise that will flood downtown Portsmouth are simply spreading fear to alarm you and me.
Some believe that climate change has made storms more severe. This is debatable. There is much evidence to the contrary. But that’s a topic for another day.
First, Let’s Discuss Tides
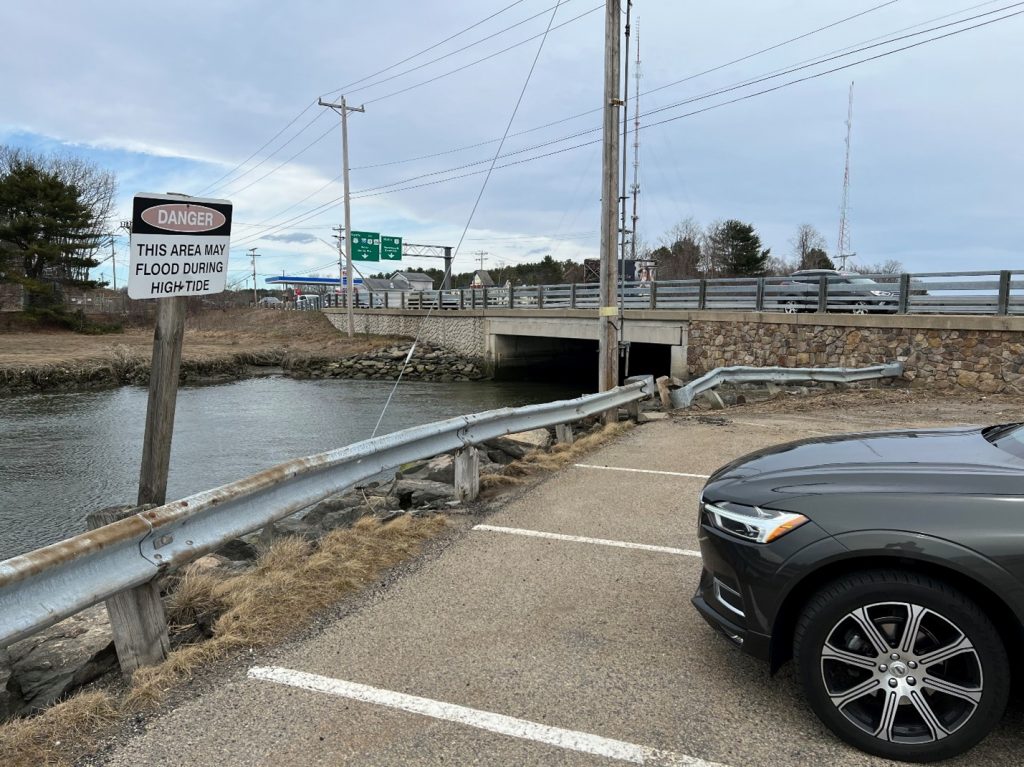
Portsmouth sits on the Piscataqua River. Twice daily it directly feels the effect of the tidal cycle. Every day there are two high tides and two low tides. Here’s a picture from the Rathskeller parking lot that is explicit about the ever-present threat of high tides. The first photo is mid-tide.
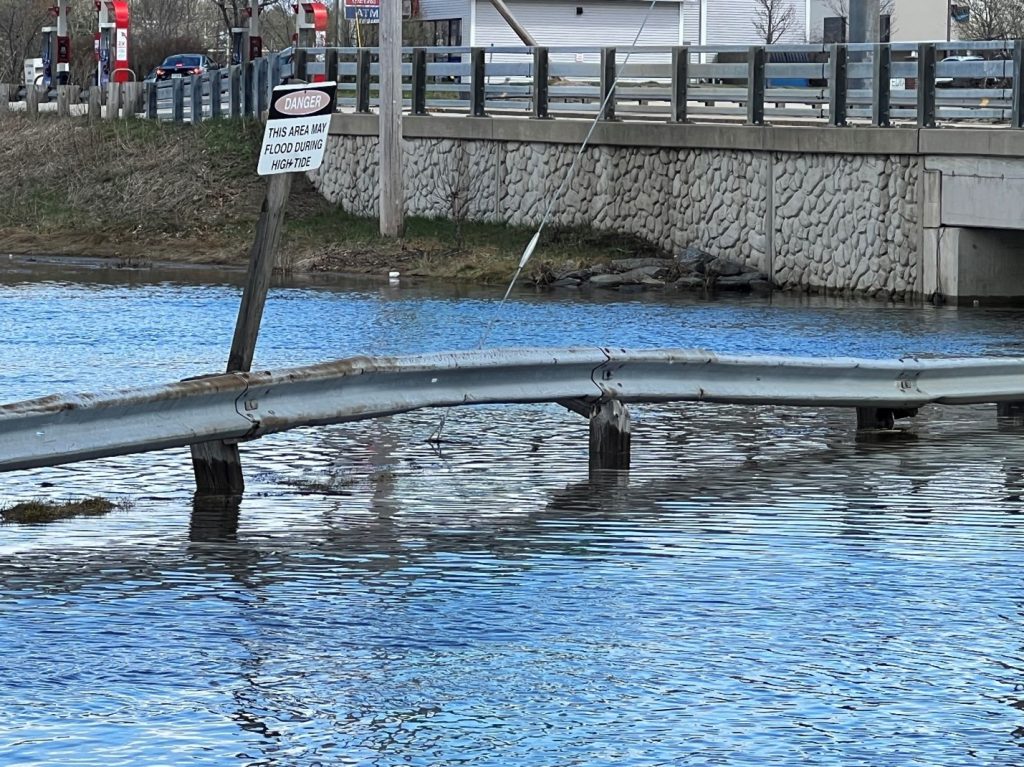
And here’s high tide. No more parking available!
What Causes Tides?
We learned in grade school that tides were caused by the moon. That’s mostly true. The sun has some effect, too.
Since the subject is complex, this discussion is liberally taken from the 2023 Eldridge Tide and Pilot Book. The source article was written by Nelson Caldwell of the Smithsonian Astrophysical Observatory in Cambridge, MA, and Hale Bradt, Department of Physics, M.I.T., Cambridge, MA.
The Moon Pulls on the Earth
The Earth “feels” the gravitational pull from nearby celestial bodies. Our closest neighbor in the sky is the moon and it has a strong influence on the Earth (and, some would say, on our behavior).
The sun is much further away, but it also exerts a tug on the Earth. It is a smaller tug because of its distance, but we can’t dismiss it.
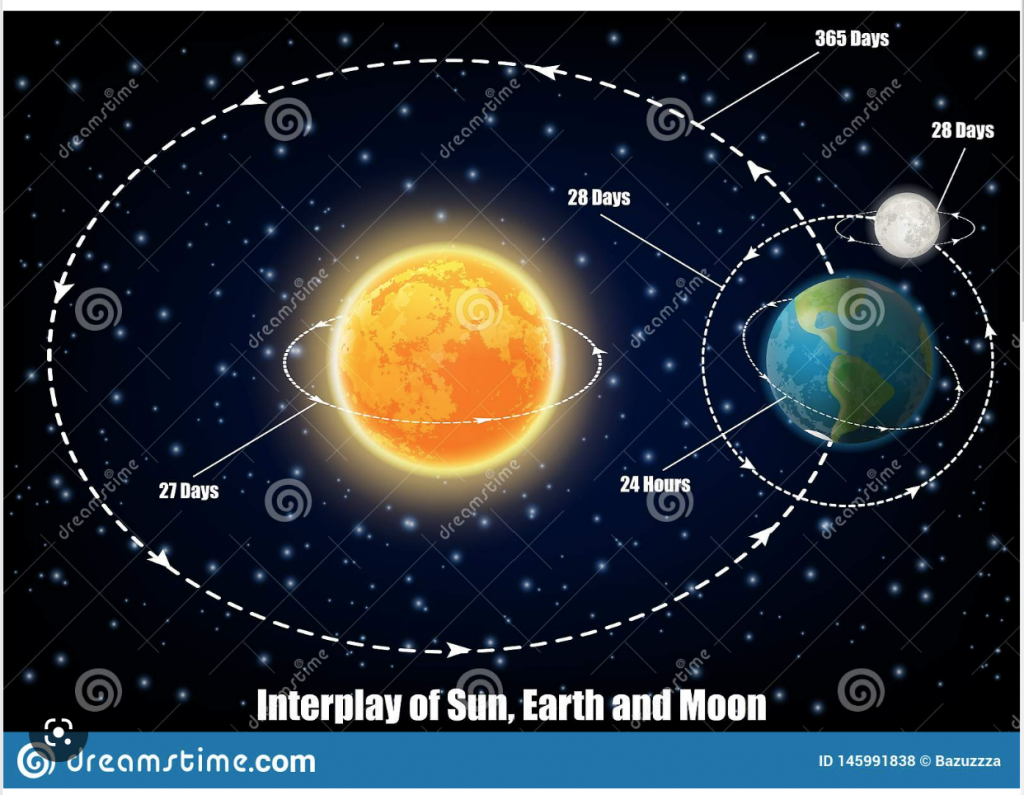
Tides are caused by the pull of gravity between the Earth and the moon, and to a lesser extent, the sun. The sun has a mass that is 27 million times that of the moon. But the moon is 390 times closer to the Earth than the sun.
The gravitational pull by the moon on the Earth is expressed as an actual bulge of the sea water closest to the moon. Due to centrifugal force, there is a bulge on the opposite side of the Earth as well.
High tides are where these bulges are.
Neither the Moon nor the Earth Are Stationary, Complicating the Story
The moon is moving relative to the Earth.
The Earth spins around its axis once approximately every 24 hours. The moon takes 27.3 days to rotate around the Earth. So, the Earth is spinning rapidly under the moon-induced watery bulges on its surface.
It takes the Earth 24 hours and 50 minutes to spin from one tidal bulge around to catch up to the same bulge, thus taking about 50 minutes later than the previous day.
There are two tidal cycles on an Earth day, that is, two high tides and two low tides. The time difference is about 6 hours and 12.5 minutes apart.
Over a week’s time, the time of the highs and lows almost become reversed. Today’s time of high tide will be next week’s time of low tide.
The Sun Also Influences the Picture
The sun’s influence is felt by the time of high tide and low tide not precisely being when the moon is exactly overhead.
Due to the sun’s size and offsetting distance, it can shift the time of the tides by up to an hour. Land masses can also impede tidal flows, causing delays in the effect of the tidal bulge being fully felt at any one locale.
“Spring Tides and Neap Tides”
If the sun and moon are lined up with each other, the combined pull is much greater and causes the bulges to also be greater.
This occurs at a full moon, when the moon is opposite from the sun. and a new moon, when it is between the sun and the Earth. These are called spring tides.
When the moon is half full, it is at right angles to the line between the Earth and the sun. The gravitational pull from the sun is countered by the gravitational pull by the moon. Thus, the bulge is reduced, and the tidal effect is reduced. These smaller tides are called neap tides.
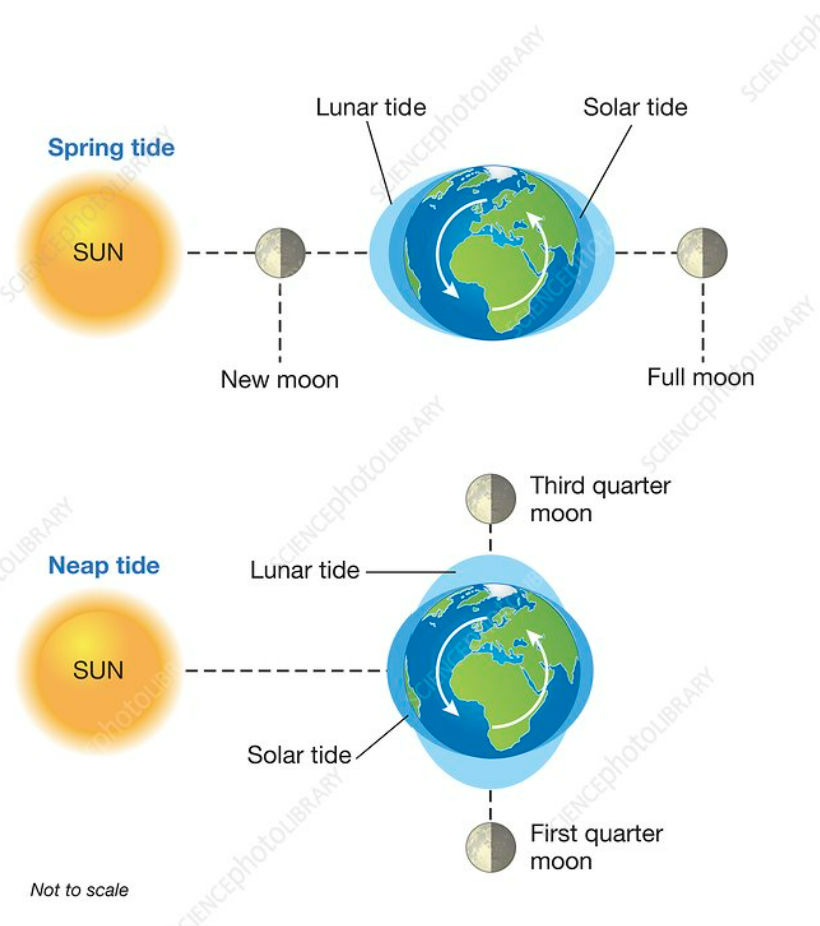
Source: Science Photo Library
Each year, we experience 26 neap tides and 26 spring tides. The difference in height of the spring tide and the neap tide at Portsmouth may be a foot or more.
As you can guess, the time when a nor-easter hits Portsmouth will have a tremendous impact on its effect on flooding depending upon the moon’s phase.
The Moon’s Elliptical Orbit Around the Earth
The next variation we need to consider is where the moon is in its orbit around the Earth. It travels along an ellipse rather than a circle. That means that it is not always at the same distance from the Earth.
At its closest distance, it is 221,000 miles. That is called its perigee. At its farthest distance, it is 252,000 miles away. That is called its apogee.
When the moon is at perigee, it appears larger. When it is at apogee, it appears much smaller.
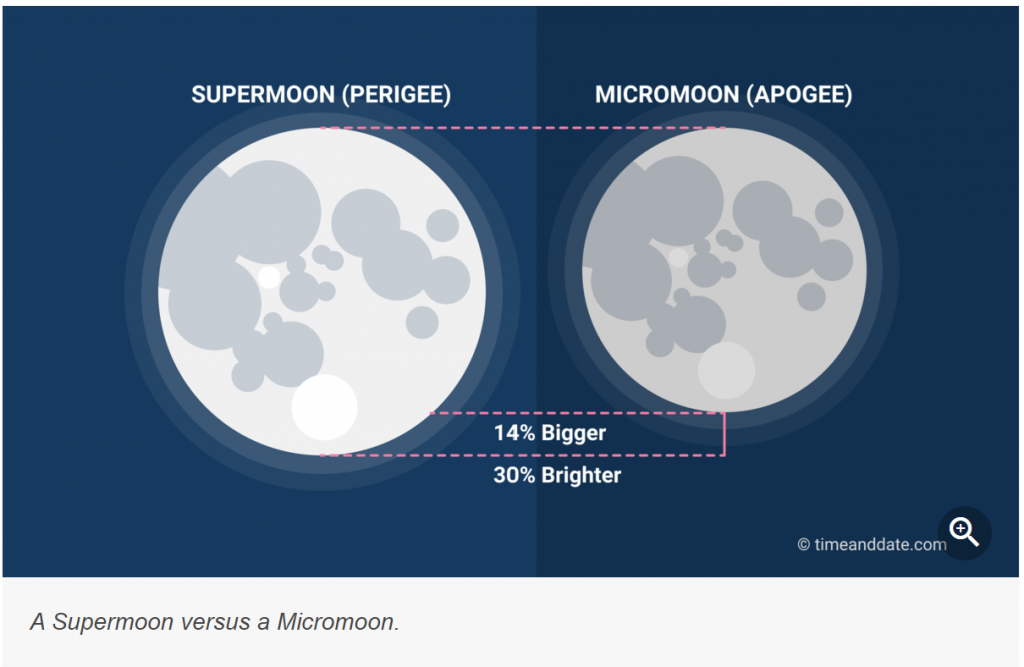
Since the moon’s distance from Earth has a huge influence over the height of the tide, this also influences how severe the effect of a nor’easter may be for flooding. A high tide at perigee may be 10% higher than on at apogee.
A Final Complication: The Moon Orbits the Earth on Its Own Plane
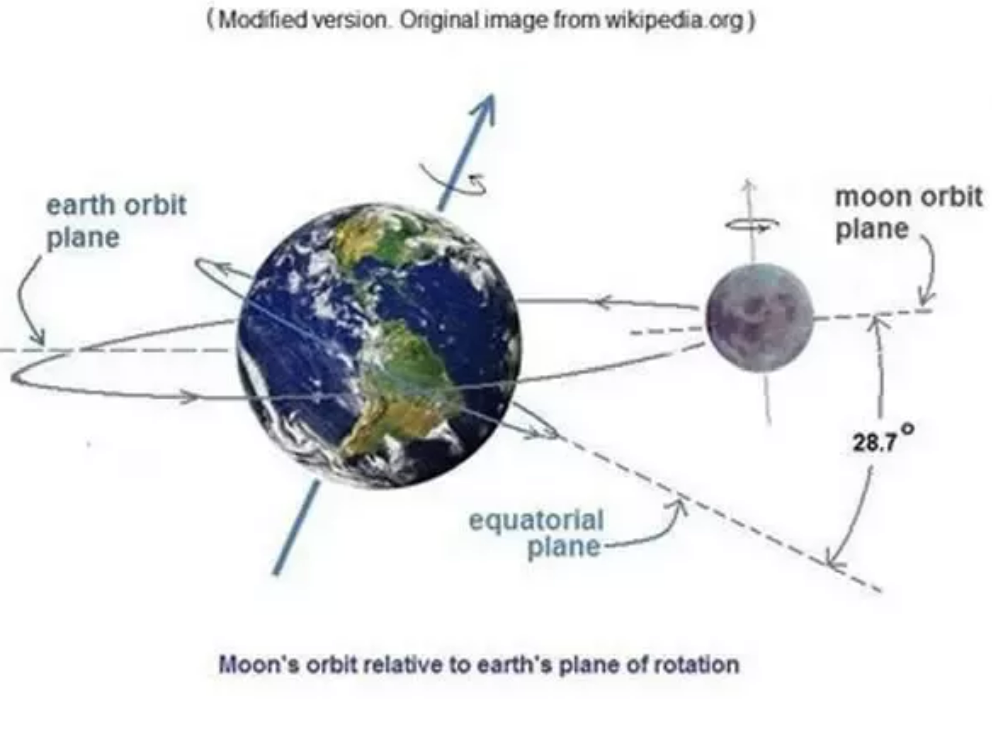
The moon’s orbit and the Earth’s orbit are not on the same plane.
The angle of the plane of the moon’s orbit to the Earth’s equator is approximately 28.7 degrees. The angle of tilt of the Earth’s axis is about 23 degrees. So, the difference between the Earth’s orbit and the moon’s orbit is about 5 degrees.
Because the Earth and Moon Orbits Are Different …
As the moon travels around the Earth, it can be above or below the equator. This is because the plane of the orbit is at an angle to the Earth’s plane of orbit around the sun.
Twice a month, the moon is directly over the equator. The effect of this position is that the two daily high tides are at about the same height.
… Usually, the Moon Is Above or Below the Equator
When the moon is above or below the equator, the two daily high tides are of different heights. This becomes important when a nor’easter approaches. If its full effect is felt at the higher of the two high tides, the extent of flooding will be much greater.
If the moon is above the equator, the highest part of the nearside bulge is under the moon.
That would be the northern hemisphere and, in our case, the mid-Atlantic northwards, including Portsmouth. This results in a very high tide.
As the moon rotates around to the far side of the globe, the high tide will be far lower.
Source: Quora
Let’s Put This All Together
Imagine now a slow-moving nor’easter coming up the coast and passing just offshore.
Also imagine that the moon is at its perigee to the Earth and the astronomical effects cause there to be spring tides, adding another two feet to the average, or mean, higher high water (MHHW) for the 24 hours the storm affects Portsmouth.
Very quickly, one can see that Portsmouth will feel the tidal effect due to the interplay of the moon and sun, apart from the storm’s effect.
Now Let’s Talk About Storm Surges
Storm surge can easily add feet of water depth on top of a high tide.
While the schematic drawing below depicts a hurricane-induced storm surge, a nor’easter is similarly created with a developing severe low-pressure cyclone with counter-clockwise winds. Dominant wind directions can vary depending on where the center of the cyclone is located. In the December 2022 storm, the center of the cyclone was located further inland and the dominant wind direction was from the south-east.
The storm surge as shown in the schematic is shown as being shoreward of the cyclone’s “eye,” or center. The low pressure creates favorable conditions for the sea water to be “sucked up” or “lifted up” as a bulge above the surrounding sea level.
But it is the wind-driven sea water that creates the more significant “pile” of sea water that is driven towards the land.
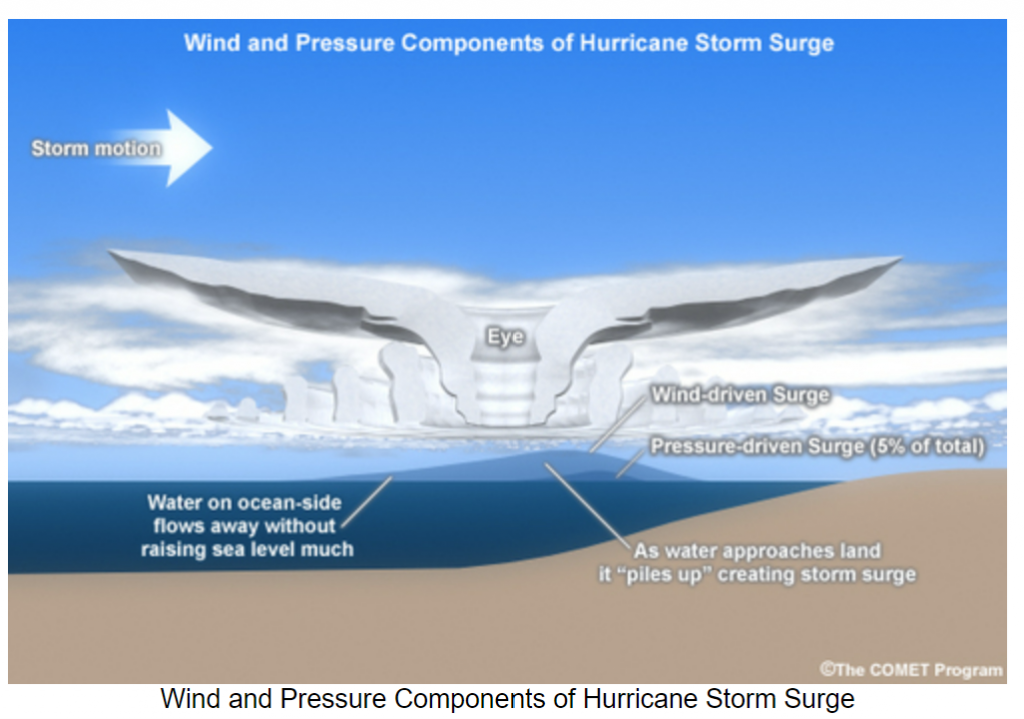
NOAA’s website has maps of the most significant examples of storm surges resulting from hurricanes starting with the Galveston Hurricane of 1904 through to Hurricane Ike of 2008. See the SLOSH reports at NOA Surge.
These hurricane surges show water heights of 5 to 20+ feet for south-facing shores. For example, downtown Providence was underwater because of the 1938 Hurricane surge.
Because Portsmouth sits within a few miles of the North Atlantic Ocean, it is very exposed to the effects of coastal storms. When a nor’easter tracks just off the coast, its counterclockwise winds push sea water towards the coast. If the wind force is strong enough and persistent enough, the sea water “heaps up” onto the northeast-facing shores and bays, causing water levels to be higher than what we would see with even the highest tides.
Within Portsmouth, exposed areas are Prescott Park, Sagamore and Witch Creeks.
Our Case Study: The December 2022 Winter Storm
We have discussed this in Part V. High tides and storm surge combined just before Christmas 2022 to produce unusually highwater levels in Portsmouth and New Castle. The New Castle causeway was flooded during the storm.
The barometric pressure at the center of the storm fell to 963 millibars, describing a historic extratropical cyclone that affected the north central U.S. to New England and parts of southern Canada.
Blizzards, high winds, snowfall and record low temperatures affected areas from Colorado to the eastern seaboard as far south as Miami.
New York Governor Kathy Hochul labeled the storm in the Buffalo area as the Blizzard of the Century. As the storm developed and the low pressure deepened, the drop in pressure created conditions favorable for a bomb cyclone.
Tides Can Be Forecasted Years into the Future
In terms of tides, our Eldridge Tide and Pilot Book for 2022 had forecasted the period between December 21st to 29th as experiencing the most extreme lunar low and high tides for almost a year.
The height of the tide in Portland, Maine was predicted to be 1.7 feet about the Mean Higher High Tide (MHHW). Similar unusually high tides were predicted south to Boston.
With the storm surge, the total water height at high tide would be just over 13 feet, according to the National Weather Service (NWS).
Our Eldridge Tide and Pilot Book for 2023 shows similarly extreme tides in 2023 for January and February. The rest of the calendar year shows more subdued tides.
How Would a Surge Affect Portsmouth?
We saw the combined effects from a surge and high tide just before Christmas 2022. The National Oceanic Atmospheric Administration has prepared SLOSH reports that show historic and projected surge inundation for coastal properties.
A nor’easter affecting Portsmouth is unlikely to create such devastating water depths as seen in the historic SLOSH reports: NOA Surge-Slosh
Portsmouth Harbor has many islands, and these islands help break the effect of the nor’easter and diminish the direct impact of the surging water.
Portsmouth Harbor is not south-facing, which further helps protect the City from the most devastating potential storm surges from northward-trending storms.
NOAA has predicted the height of a storm surge with a 1% chance of probability of occurrence to be 7.78 feet above the MHHW level. This is equivalent to the 100-year flood plain as mapped by NOAA.
While not explicitly included, the 100-year flood plain includes the effects of astronomically high tides.
The 2015 study entitled “Tides to Storms: Preparing for New Hampshire’s Future Coast” maps the effects of sea level rise and storm surge.
Given all we have discussed in Parts I through V, the prospect of a 1.7-foot sea level rise by 2050 seems overstated.
The same report estimates a sea-level rise of 6.3 feet by 2100. This latter value seems outlandish given the NOAA data we have discussed in earlier articles.
Using the NOAA data from the past century, a 75-year projection suggests a sea-level rise of 6 to 9 inches from today.
The “Tides to Storms” Forecast Is Extreme
Adding the NOAA 1% probability surge level of 7.78 feet above MHHW to our projected 6- to 9-inch sea level rise by 2100 would create a new potential surge level of 8.3 feet.
This is 10 feet lower than the “higher emissions” forecast from the 2015 report. Today’s 100-year flood plain maps are likely to be sufficient for planning purposes at least for the next 25 years.
The reader can examine a very useful display, the current detailed 100-year flood map for Portsmouth, by going to the New Hampshire Flood Hazards Viewer: Flood Hazards.
Keep Things in Perspective
The effects of tides and storm surges are very important as they can inundate significant portions of Portsmouth’s waterfront.
The risk of such inundation is captured in the current NOAA-generated 100-year flood plain maps for Portsmouth. Sea-level rise, though, is not the most important part of the risk assessment.
In the next 25 to 75 years, our analysis shows that sea level rise is not expected to add more than 9 inches to the water height for Portsmouth’s shoreline based on historical patterns.
Furthermore, there are some areas of Portsmouth’s shoreline, such as Prescott Park, which will experience greater flooding. However, that is more because of land subsidence, not sea level rising.
Source Featured Image: Universetoday.com


